Exploring Data Variables in the Titanic Dataset: A Step-by-Step Guide to EDA
Unlocking Insights: Identifying and Classifying Data Variables in Exploratory Data Analysis (EDA) using the Titanic Dataset

Oracle Data/Application Consultant | Machine Learning Enthusiast | Data Scientist | Python Developer
One of the essential steps in Exploratory Data Analysis (EDA) is to look into the kinds of variables present in the dataset i.e. if a variable is numerical, nominal, ordinal, categorical, etc. Based on the found insights, one can apply the necessary preprocessing on these variables to get desired outcomes. Let's take a deep dive into the process of exploring data variables with the help of Titanic Dataset.
What are Data Variables?
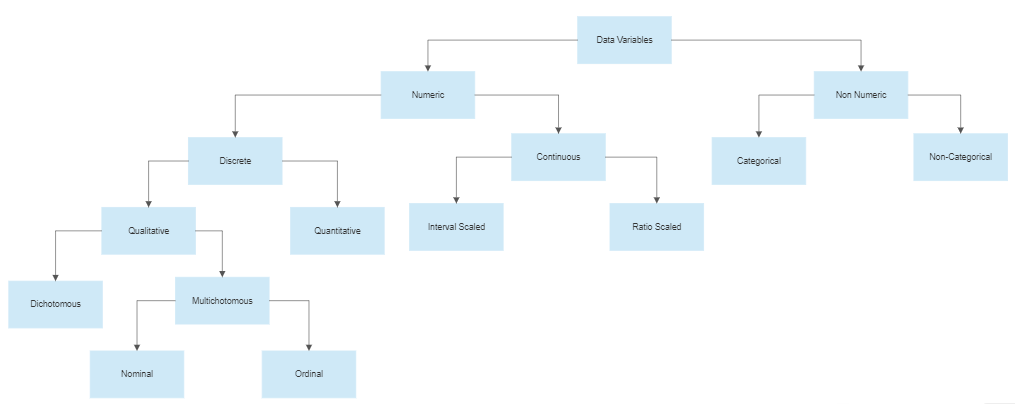
Data Variables are values that represent some characteristic or property of some object. These values may be some number, category, or non-numeric piece of information, etc. Data Variables are classified into different kinds based on various conditions. The hierarchy tree below shows the whole process as an illustration:
Before we move on, let's first load the Titanic dataset so that we can classify its variables as per the given hierarchy in a step-by-step fashion. I am going to use python's pandas library to achieve this task. For the dataset, I am going to use seaborn's load_dataset() method to get the data.
import pandas as pd
from seaborn import load_dataset
#Loading the Titanic Dataset
titanic_df = load_dataset('titanic')
#We can view the dataset rows using the head() method
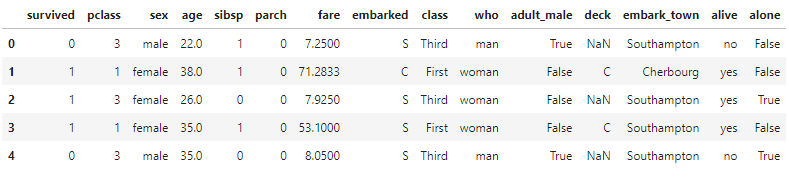
print(titanic_df.head())
On displaying the rows of the dataset, we get the following result:
Numeric and Non-Numeric Variables
We can classify each of these variables as either numeric or non-numeric. To do so, we need to first identify the data types of each of these variables i.e. whether they represent some numeric data type (e.g. float, int, etc.) or some non-numeric data type (e.g. string, boolean, etc.). Let's classify by making use of the loaded data frame:
#Viewing the information of the loaded dataset
print(titanic_df.info())
This displays the following output on the screen:
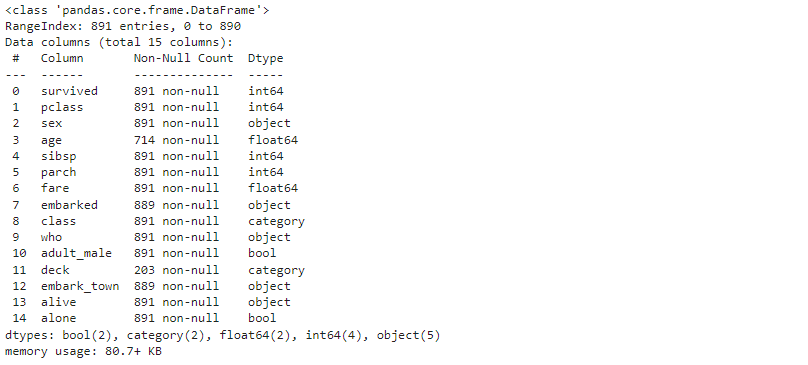
Here, we can observe that we have 5 different data types i.e.
int64 (survived, pclass, sibsp, parch) = Numeric
float64 (age, fare) = Numeric
object (sex, embarked, who, embark_town, alive) = Non-Numeric
bool (adult_male, alone) = Non-Numeric
category (class, deck) = Non-Numeric
Thus, we can classify the features into numeric (survived, pclass, sibsp, parch, age, fare) and non-numeric (sex, embarked, who, embark_town, alive, adult_male, alone, class, deck)
Discrete and Continuous Variables
Numeric variables can be further classified into discrete and continuous variables. Discrete variables are integer based whereas continuous are floating-point based. One thing to remember in classifying these variables is to ensure that a continuous variable can represent a discrete variable in disguise (by using trailing zeros with an integer value). Let's see how to identify these:
#Method to check if a variable is integer or floating point
def check_discrete(df, var):
    res = all(x.is_integer() for x in df[var])
    if res:
        print("{} is a discrete variable".format(var))
    else:
        print("{} is a continuous variable".format(var))

#Applying method on all continuous variables to check the result
cont_cols = ['age', 'fare']
for col in cont_cols:
    check_discrete(titanic_df, col)
This piece of code displays the following output on the screen:
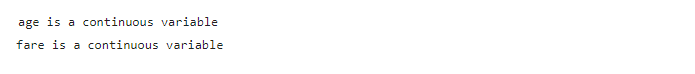
Thus, we have classified the obtained numeric variables as discrete (survived, pclass, sibsp, parch) and continuous (age, fare).
Qualitative vs Quantitative Discrete Variables
Discrete variables can be further classified into qualitative and quantitative variables. Qualitative are those that represent some sort of property or quality but in a numeric form (usually a category of some sort) whereas quantitative are those that represent some measured quantity or amount.
To determine these classes, we make use of our intuition to come up with the decision based on the name/description of the variable. If the variable corresponds to some textual category, then it is qualitative, otherwise, if it represents some measured quantity, then it is quantitative.
For our case, we can classify our discrete variables into qualitative (survived, pclass) and quantitative (sibsp, parch).
Dichotomous vs Multichotomous Variables
Qualitative variables can be classified into dichotomous and multichotomous based on the number of categories they represent. If the categories are exactly two, then it is a dichotomous variable, otherwise, it is multichotomous.
To find the number of unique values present in a variable, we are going to make use of DataFrame's nunique() method. Let's see it in action:
#Method to check number of unique values and decide type of qualitative varaible
def check_dichotomous(df, var):
    res = df[var].nunique()
    if res == 2:
        print("{} is a dichotomous variable".format(var))
    else:
        print("{} is a multichotomous variable".format(var))

#Applying the method to all qualitative variables
qual_cols = ['survived', 'pclass']
for col in qual_cols:
    check_dichotomous(titanic_df, col)
This results in the following output:

Thus, we have classified qualitative variables as dichotomous (survived) and multichotomous (pclass).
Nominal and Ordinal Variables
Mutlichotomous variables can be further classified into nominal or ordinal. If the variable represents some kind of rank among its value, then it falls into the ordinal category, otherwise, it is considered nominal.
The decision for nominal and ordinal takes place based on self-observation of the variable. If it looks like that it represents some sort of ranking e.g. living status, performance, etc. it is considered ordinal and if it doesn't e.g. color, countries, etc. it is considered nominal.
For our case, we can classify the given multichotomous variable as ordinal since pclass represents the passenger ticket class which is ranked in nature
Interval-Scaled and Ratio-Scaled Variables
Just like discrete variables, we can classify continuous variables into interval-scaled and ratio-scaled. The basis of this classification is the presence of an absolute zero value for all units of measurement for a particular variable.
If the variable has the same absolute zero value for all its units, it is considered to be a ratio-scaled variable. A common example of this is money (if someone has 0 money, it doesn't matter what currency he uses, it would still be 0).
If the variable doesn't have the same absolute zero value for its units, then it is considered as interval-scaled. A common example is the temperature (if someone measures 0 Celsius temperature, it would be equivalent to 32 Fahrenheit, not 0).
Determining interval and ratio scales is based on the individual's observation. For our case, we will classify all the continuous variables (age, fare) as ratio-scaled.
Categorical and Non-Categorical Non-Numeric Variables
Non-numeric variables can also be classified as categorical or non-categorical. Some people even consider all non-numeric variables to be categorical. Anyways, the difference between the two is that categoricals are meant to represent some category whereas non-categoricals don't. In fact, the purpose of non-categorical is to be used for some processing method to find insights from them e.g. extracting country code from a phone number, etc.
Determination of categorical variables is based on observation as well as we have to decide whether the variable makes sense as a category or not. For our case, we can classify all the variables (sex, embarked, who, embark_town, alive, adult_male, alone, class, deck) as categorical (since each represents some sort of category)
We can make use of the same hierarchy pattern used in qualitative discrete variables to further classify these variables. After doing so, we get the following result:
Dichotomous (sex, alive, adult_male, alone)
Nominal (embarked, who, embark_town, deck)
Ordinal (class)
Conclusion
In this article, I discussed the various kinds of data variables and how their classification takes place with the help of the titanic dataset. The final results of the investigation give us the following results:
| Variable Name | Variable Kind |
| survived | Dichotomous Discrete Variable |
| pclass | Ordinal Discrete Variable |
| sex | Dichotomous Non-Numeric Variable |
| age | Ratio-scaled Continuous Variable |
| sibsp | Quantitative Discrete Variable |
| parch | Quantitative Discrete Variable |
| fare | Ratio-scaled Continuous Variable |
| embarked | Nominal Non-numeric Variable |
| class | Ordinal Non-numeric Variable |
| who | Nominal Non-numeric Variable |
| adult_male | Dichotomous Non-numeric Variable |
| deck | Nominal Non-numeric Variable |
| embark_town | Nominal Non-numeric Variable |
| alive | Dichotomous Non-Numeric Variable |
| alone | Dichotomous Non-Numeric Variable |
Using the same approach, we can apply the following classification on any dataset to get a good understanding of what the role of the variable is and how to preprocess it.
That's it for today! Hope you enjoyed the article and got to learn something from it. Don't forget to comment with your feedback on the approach. How do you perform the classification of variables in a given dataset? Do share your approach in the comments.
For a detailed perspective of the topic, you can visit here, where I have undergone this topic in a little bit more detail, and don't forget to ⭐ it. Thanks for reading! Hope you have a great day! 😄😄


